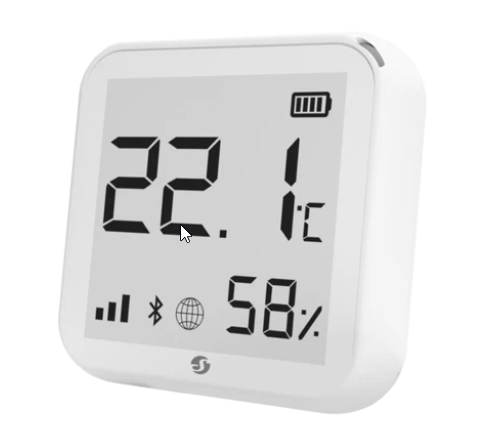
I bought a little Wi-Fi thermometer, a Shelly H+T. Neat product; eInk display, wifi, runs on 4 AA batteries for a year. I don’t know much about Shelly but it seems fairly hacker friendly. In particular you can run the thing in local network mode and not use their cloud service at all.
Setting up Shelly
First challenge was getting the device up and running. The docs are good and there’s several routes. I went the WiFi only route (no Bluetooth); you plug the device in, get it into AP config mode by holding the reset button in the battery compartment. It creates a WiFi network for itself and runs a web server on 10.33.1.1 which you can then use to configure it. You have to work fast; even plugged in to a USB power source it seems to only want to run for 30 seconds before going in to sleep mode. The main configuration required is to tell it your wifi network details to connect to your LAN.
First step after that was to flash the firmware. Glad I did, they completely changed everything. Next step was to configure it to do something useful. Because it’s low power you can’t really poll the device, most of the time the WiFi is off. So instead it wants to push data.
Shelly is remarkably sophisticated and has a lot of thoroughly documented connection options. I chose MQTT with their default settings because it seemed the simplest path.
Setting up MQTT
I’m not a fan of MQTT, it’s too complicated. But it is a standard and there are tools. I found this guide helpful in getting started. It has you installing mosquitto for a MQTT server (“broker”), mosquitto-clients for testing, then setting up telegraf to be an MQTT listener for data logging to influx and thus Grafana.
mosquitto takes some config; by default it will only listen on localhost. You have to configure authentication. I used a simple username/password, probably “no auth” would be fine on my LAN too. Note this configuration has to occur before a line like listener 1883, defining which mqtt instance you’re setting up. (See what I mean about complicated?)
Then I pointed Shelly at the MQTT broker (no SSL, port 1883, username and password) and.. nothing. There’s a log file in /var/log/mosquitto but it didn’t have much useful in it. So I added connection_messages true to the configuration and then I could at least see that Shelly was connecting. No data logged to a file though.
To get the data you have to use mosquitto_sub to subscribe and listen to the data. There’s a concept of “topics”, which kind of events you listen to; # is a wildcard. You can also use mosquitto_pub to send test messages. Honestly to figure all this out I asked ChatGPT how to use it and it told me. Way easier than reading docs and it happened to work this time. (ChatGPT failed later producing telegraf configs.)
With all that set up I got Shelly logging overnight. It seems to log to two topics: shellyplusht-b8d61a8b17cc/events/rpc and shellyplusht-b8d61a8b17cc/online. The useful data is in the RPC.
The important RPC payload is a JSON blob method named NotifyFullStatus and a wakeup_reason of status_update. The data itself is in params and the key thing is data blocks for temperature and humidity.
Not clear on update frequency. When it was plugged in I was getting updates every 305 seconds or so. There was some status indication that suggests it wants to update every 600 seconds; I guess 300 is when it starts trying and the extra 5 is getting wifi online? On battery it updates less often, I think only when a measurement changes significantly. There’s a setting in the firmware where you can make it wake up for every change of 0.5°C or 1% humidity.
Anyway, Shelly is working and publishing to MQTT. Now to get the data somewhere useful.
Logging to Influx
Telegraph can take input from MQTT. It took some levering to get this working but I finally got telegraf to just store all the fields that are in the JSON data blog from Shelly. Here’s the config:
[[inputs.mqtt_consumer]]
  servers = ["tcp://127.0.0.1:1883"]
  topics = ["shellyplusht-b8d61a8b17cc/events/rpc"]
  username = "shelly"
  password = "hunter2"
  data_format = "json"
  # json_time_key = "params.ts"
  # json_time_format = "unix"
  tag_keys = ["method"]
  json_query = "params"
This logs all RPC messages from shelly; the useful ones with data but also other RPCs. It also logs all the measurements, many of which are not so useful, but it’s just easier this way and it’s only logging every 5 minutes at most.
Note the commented out date parsing. I’m sure I got that JSON key name right but telegraf couldn’t find it, at least in some of its inputs. I gave up. Instead telegraf will log with its own timestamp rather than the one Shelly reported. That’s OK most of the time but if Shelly buffers any data and uploads it in bulk it will be a problem.
Also the “tag_keys” seems to be useless. I was hoping to use influx tags to filter just on the NotifyFullStatus responses and not the other junk. No idea why but it’s not ending up in the database.
I probably should have tried json_v2 as the telegraf parser.
(An aside on testing telegraf with systemd. systemctl reload telegraf does work but sometimes delays, I think telegraf waits until the agent finished its last run. journalctl -f -u telegraf is a useful way to watch the telegraf log file. Shelly only logs every 5 minutes so it’s a slow process of testing.)
Calibration
A man with two clocks never knows what time it is. None of these devices are precisely calibrated so I don’t know for sure what’s right. Shelly has an option in the firmware to add a static offset for calibration so I can at least get it to line up with the Laseregg.
When I first was using it, my LaserEgg said 70.5°F, Shelly said 72.7°F. A Taylor thermoprobe (for cooking) says 71.5°F (both air and a glass of water). In general the Shelly is reading 2-3°F more than the LaserEgg and 2% less humidity.
But then I put Shelly in the fridge for 10 minutes, and it dutifully read colder. Then I took it out. Now 12 hours later Shelly and the LaserEgg are basically reading the same without me putting in a calibration offset at all.
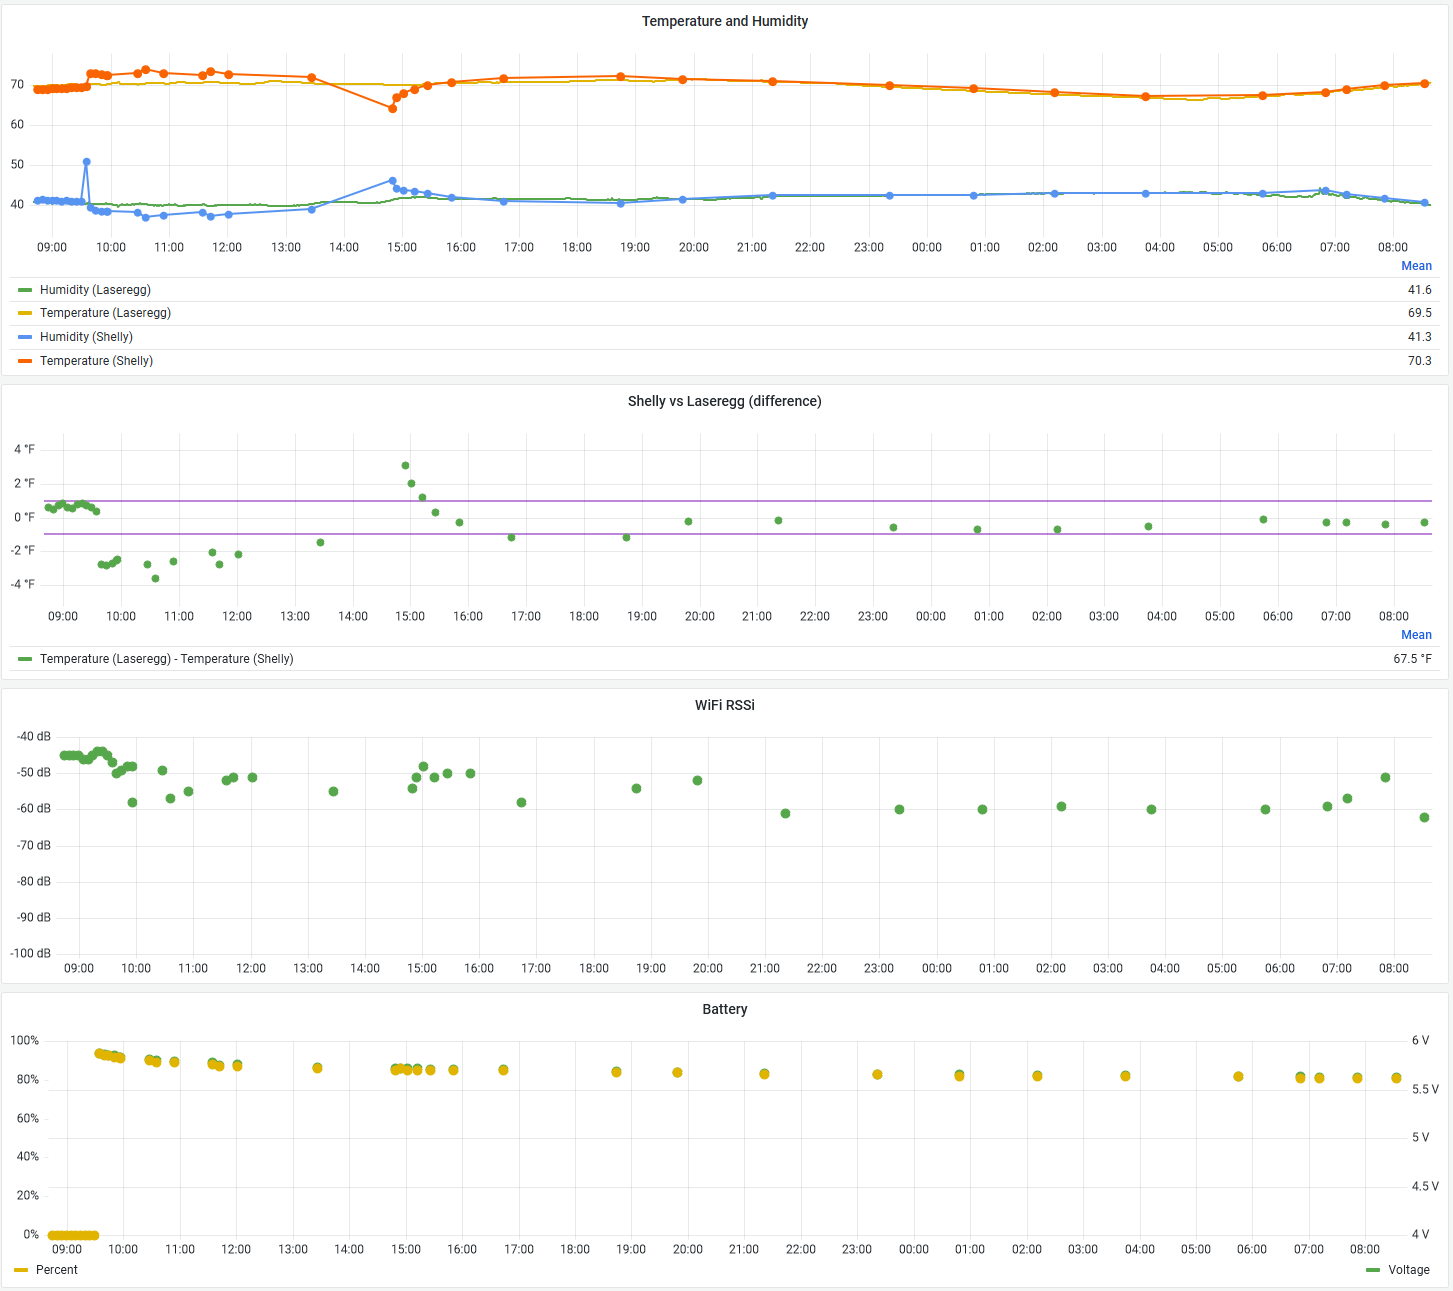
Graph
Here’s 24 hours of my far-too-complex set of graphs of Shelly data. Top two are calibrating temperatures between Shelly and the Laseregg, bottom two are status just from Shelly. The weird dip in temperature is when I locked Shelly in the fridge